However, the chart suggests that KRE's worst days are behind it, and indeed that it is poised for a significant upturn.
The Chart
KRE peaked in March at $42.79, ending wave 3 {+3}, an uptrend underway since 2011. It has since been in a counter-trend correction.
The correction is taking the form of a triangle. In Elliott wave analysis (and traditional charting as well), a triangle is a sideways movement that eventually results in a sharp rise or fall from the apex.
Click on chart to enlarge.
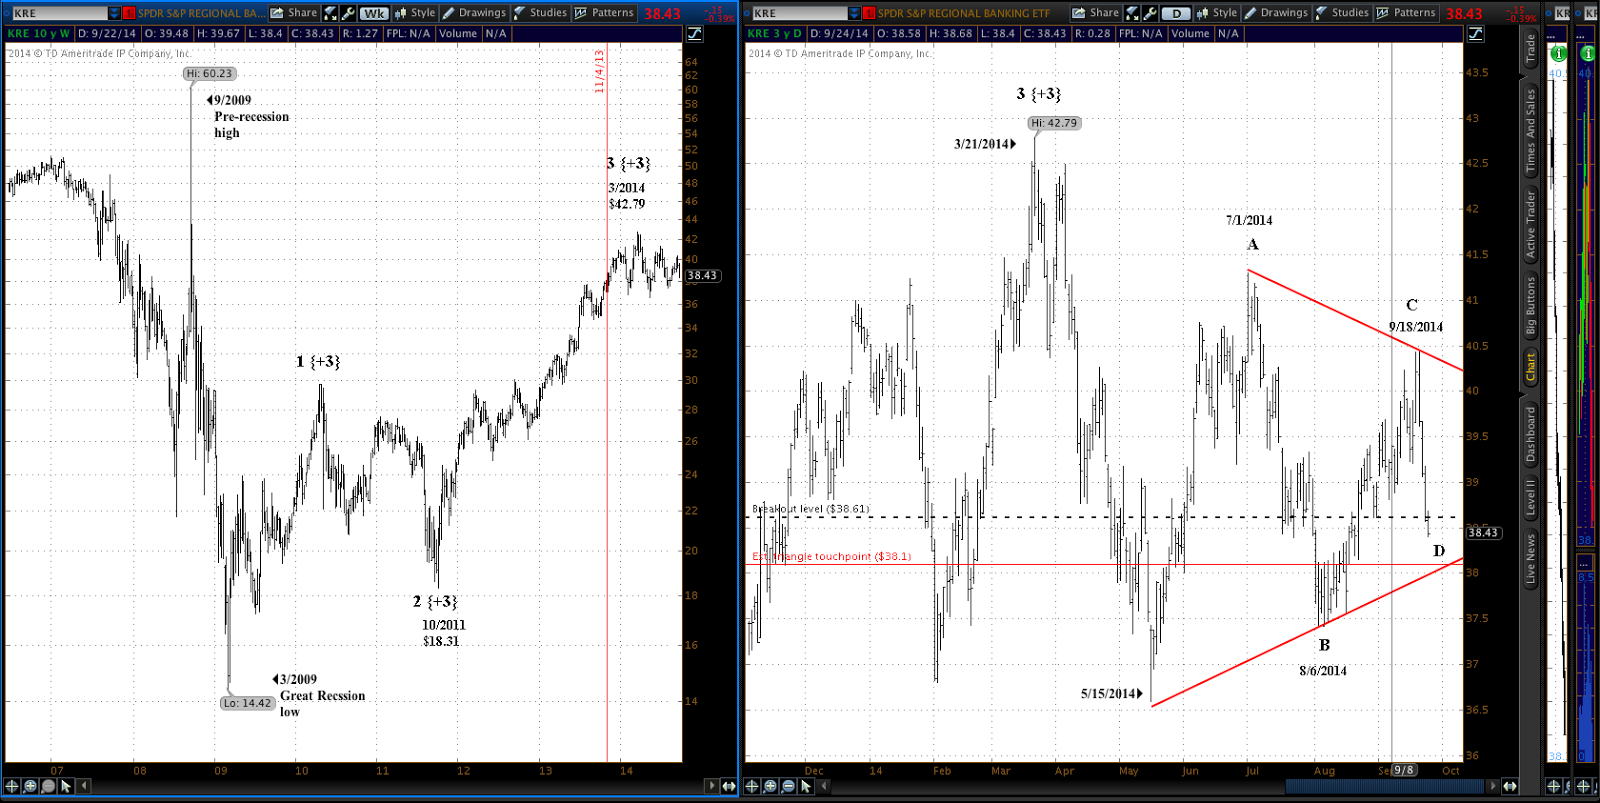 |
| KRE 10 years weekly bars (left), 3 years daily bars (right) |
In other words, there's less than a percent of downside potential with this bear signal, and more than 5% to the upside.
This chart argues decisively against opening a bear position in KRE. This chart shows a whipsaw in the making.
Odds and Yields
KRE has completed two bear signals since the March peak, both of them successful but with small yields, as one would expect with a triangle. On average they yielded 0.9% over 43 days.
Decision for My Account
At this point I can cut the analysis short and go directly to a decision.
I won't open a bear position in KRE. The chart is too prone to whipsaws. I consider a directional trade at this point to be a certain loser at worst, and an inconsequential success at best.
Once the price reverses off of the lower boundary of the triangle, then the ensuing bull signal must be taken very seriously indeed.
-- Tim Bovee, Portland, Oregon, Sept. 24, 2014
References
My shorter-term trading rules can be read here. My longer-term trading rules can be read here. And the classic Turtle Trading rules on which my rules are based can be read here.
From time to time I use the number 68.2% in using applied volatility to calculate the expected trading range. This comes from statistics and refers to the one standard deviation boundaries, which are expected to contain 68.2% of whatever is being studied. Putting it another way, given an item (a trade or whatever), there is a 68.2% chance that it will appear within those boundaries.
Elliott wave analysis tracks patterns in price movements. The principal practitioner of Elliott wave analysis is Robert Prechter at Elliott Wave International. His book, Elliott Wave Principle, is a must-read for people interested in this form of analysis, as is his most recent publication, Visual Guide to Elliott Wave Trading.
Several web sites summarize Elliott wave theory, among them, Investopedia, StockCharts and Wikipedia.
See my post "Chart Analysis: Nomenclature" for an explanation of my method for labeling waves on the chart.
By preference I place my shorter-term trades in the last half hour before the closing bell in New York. See my essay "When is the best time to trade" for a discussion of the practice.
Disclaimer
Tim Bovee, Private Trader tracks the analysis and trades of a private trader for his own accounts. Nothing in this blog constitutes a recommendation to buy or sell stocks, options or any other financial instrument. The only purpose of this blog is to provide education and entertainment.
No trader is ever 100 percent successful in his or her trades. Trading in the stock and option markets is risky and uncertain. Each trader must make trading decisions for his or her own account, and take responsibility for the consequences.License

All content on Tim Bovee, Private Trader by Timothy K. Bovee is licensed under a Creative Commons Attribution-ShareAlike 4.0 International License.
Based on a work at www.timbovee.com.
No comments:
Post a Comment