Friday, July 31, 2015

Friday's Outcomes

I exited the calls in my AMZN position to avoid exercise.

-- Tim Bovee, Fukuoka, Japan, July 31, 2015

References

My volatility trading rules can be read here.

Alerts

Two social media feeds provide notification whenever something new is posted.
Disclaimer
Tim Bovee, Private Trader tracks the analysis and trades of a private trader for his own accounts. Nothing in this blog constitutes a recommendation to buy or sell stocks, options or any other financial instrument. The only purpose of this blog is to provide education and entertainment.
No trader is ever 100 percent successful in his or her trades. Trading in the stock and option markets is risky and uncertain. Each trader must make trading decision decisions for his or her own account, and take responsibility for the consequences.
License

Creative Commons License

All content on Tim Bovee, Private Trader by Timothy K. Bovee is licensed under a Creative Commons Attribution-ShareAlike 4.0 International License.

Based on a work at www.timbovee.com.

Thursday, July 30, 2015

Friday's Prospects

On Thursday, July 30:

Of 500 large-cap stocks and exchange-traded funds in my analytical universe, 27 broke beyond their 20-day price channels, 23 to the upside and four to the downside.

No symbols that gave trading signals survived initial screening.

There are no prospects for trades coinciding with earnings announcements under my Volatility Rules.

With no symbols having made it past the early screening, I shall do no further analysis on Friday, July 31.

Earnings season began July 8, with peak announcements lasting for three weeks. Under the exclusion rule that forbids me from opening new positions in stocks within 30 days of an earnings announcement, in month before the season begins increasing numbers of symbols will be removed from my prospective trades list during initial screening. The rule doesn't apply to trades under my Volatility Rules.

Methodology

The stocks in my analytical universe all have analyst coverage through the stock-ranking company Zacks Investment Research. Not all of the exchange-traded funds are so covered.

I screen the symbols for historical odds of a profitable signal in the direction of the breakout for the past 12 months.

For symbols whose odds of success are in the top or bottom thirds, I next screen for 1) suitability of the options grid, including implied volatility of three figures or greater on the strike prices I would need to use to build a position, 2) implied volatility in the 70th percentile or greater of its most recent rise, and 3) the absence of an earnings announcement within the next 30 days.

-- Tim Bovee, Fukuoka, Japan, July 30, 2015

References

My trading rules can be read here.

Alerts

Two social media feeds provide notification whenever something new is posted.
Disclaimer
Tim Bovee, Private Trader tracks the analysis and trades of a private trader for his own accounts. Nothing in this blog constitutes a recommendation to buy or sell stocks, options or any other financial instrument. The only purpose of this blog is to provide education and entertainment.
No trader is ever 100 percent successful in his or her trades. Trading in the stock and option markets is risky and uncertain. Each trader must make trading decision decisions for his or her own account, and take responsibility for the consequences.
License

Creative Commons License

All content on Tim Bovee, Private Trader by Timothy K. Bovee is licensed under a Creative Commons Attribution-ShareAlike 4.0 International License.

Based on a work at www.timbovee.com.Tss s ss'ss

Thursday's Outcomes

I declined to take trades in FEYE and LNKD and did partial exits of SNDK and SWKS. I've updated the four analyses details.

-- Tim Bovee, Fukuoka, Japan, July 30, 2015

References

My volatility trading rules can be read here.

Alerts

Two social media feeds provide notification whenever something new is posted.
Disclaimer
Tim Bovee, Private Trader tracks the analysis and trades of a private trader for his own accounts. Nothing in this blog constitutes a recommendation to buy or sell stocks, options or any other financial instrument. The only purpose of this blog is to provide education and entertainment.
No trader is ever 100 percent successful in his or her trades. Trading in the stock and option markets is risky and uncertain. Each trader must make trading decision decisions for his or her own account, and take responsibility for the consequences.
License

Creative Commons License

All content on Tim Bovee, Private Trader by Timothy K. Bovee is licensed under a Creative Commons Attribution-ShareAlike 4.0 International License.

Based on a work at www.timbovee.com.

LNKD Analysis

Update 7/30/2015: The premium fell, sending the risk/reward ratio up to 2.8:1, an overly high level by my standards. I've declined to take the trade., 

The work-oriented social networking company LinkedIn Corp. (LNKD), headquartered in Mountain View, California, publishes earnings on Thursday after the closing bell.
[LNKD in Wikipedia]

LNDK

I shall use the AUG1 weekly series of options, which trades for the last time eight days hence, on Aug. 7.

Ranges

Click on chart to enlarge.
LNKD after the July 29 close, 30 days hourly bars
Implied volatility stands at 57.9%, which is 4.6 times the VIX, a measure of volatility of the S&P 500 index. LNKD’s volatility stands in the 87th percentile of its most recent rise.

Ranges implied by options and the chart
WeekSD1 68.2%SD2 95%ChartEarns
Upper251.88271.75233.18263.76
Lower212.12192.25202.75180.24
Gain/loss8.6%17.1%
Implied volatility 1 and 2 standard deviations; chart support and resistance, maximum earns move

The Trade

Iron condor, short the $265 calls and long the $270 calls,
short the $195 puts and long the $190 puts,
sold for a credit and expiring Aug. 8.
Probability of expiring out-of-the-money

AUG1StrikeOTM
Upper26583.8%
Lower19583.7%

The premium is $1.57, which is 31% of the width of the position’s wings.The stock at the time of analysis was priced at $232.

The risk/reward ratio is 2.2:1.

The zone of profit in the proposed trade covers a $35 move either way. The biggest immediate move after each of the past four earnings announcements was $51.78 and the average was $31.12.

Decision for My Account

I intend to open a position in LNKD as reported above. I'm posting this analyze before the market open, and shall up it if events force change in my plans.

-- Tim Bovee, Fukuoka, Japan, July 30, 2015

References

My volatility trading rules can be read here.


Alerts


Two social media feeds provide notification whenever something new is posted.

Disclaimer
Tim Bovee, Private Trader tracks the analysis and trades of a private trader for his own accounts. Nothing in this blog constitutes a recommendation to buy or sell stocks, options or any other financial instrument. The only purpose of this blog is to provide education and entertainment.
No trader is ever 100 percent successful in his or her trades. Trading in the stock and option markets is risky and uncertain. Each trader must make trading decisions for his or her own account, and take responsibility for the consequences.
License

Creative Commons License

All content on Tim Bovee, Private Trader by Timothy K. Bovee is licensed under a Creative Commons Attribution-ShareAlike 4.0 International License.

Based on a work at www.timbovee.com.

Wednesday, July 29, 2015

FEYE Analysis

Update 7/30/2015: Implied volatility dropped to 58.6 in Thursday's trading, pushing the premium down and the risk/reward ratio up to 3:1, which is too high by my standards. The decline moved volatility down into the 47th percentile of its most recent rise. I'm declining to take the trade.

The cybersecurity company FireEye Inc. (FEYE), headquartered in Milpitas, California, publishes earnings on Thursday after the closing bell.
[FEYE in Wikipedia]

FEYE

I shall use the AUG1 weekly series of options, which trades for the last time eight days hence, on Aug. 7.

Ranges

Click on chart to enlarge.
FEYE after the July 29 close, 30 days hourly bars
Implied volatility stands at 59.6%, which is 4.8 times the VIX, a measure of volatility of the S&P 500 index. FEYE’s volatility stands in the 83rd percentile of its most recent rise.

Ranges implied by options and the chart
WeekSD1 68.2%SD2 95%ChartEarns
Upper51.7455.9350.9452.67
Lower43.3439.1544.5242.71
Gain/loss8.8%17.7%
Implied volatility 1 and 2 standard deviations; chart support and resistance, maximum earns move

The Trade

Iron condor, short the $53 calls and long the $54 calls,
short the $42.50 puts and long the $41.50 puts,
sold for a credit and expiring Aug. 8.
Probability of expiring out-of-the-money

AUG1StrikeOTM
Upper5380.8%
Lower42.576.4%

The premium at the time of analysis was $0.37, which is 37% of the width of the position’s wings.The stock at the time of purchase was priced at $47.54.

The risk/reward ratio is 1.7:1.

The zone of profit in the proposed trade covers a $5.25 move either way. The biggest immediate move after each of the past four earnings announcements was $5.13, and the average was $3.76.

Decision for My Account

I intend to open a position in FEYE as described above. The analysis was done prior to the market open on the day I shall trade, and I'll update this analysis if events force a change in plans.

-- Tim Bovee, Fukuoka, Japan, July 30, 2015

References

My volatility trading rules can be read here.


Alerts


Two social media feeds provide notification whenever something new is posted.

Disclaimer
Tim Bovee, Private Trader tracks the analysis and trades of a private trader for his own accounts. Nothing in this blog constitutes a recommendation to buy or sell stocks, options or any other financial instrument. The only purpose of this blog is to provide education and entertainment.
No trader is ever 100 percent successful in his or her trades. Trading in the stock and option markets is risky and uncertain. Each trader must make trading decisions for his or her own account, and take responsibility for the consequences.
License

Creative Commons License

All content on Tim Bovee, Private Trader by Timothy K. Bovee is licensed under a Creative Commons Attribution-ShareAlike 4.0 International License.

Based on a work at www.timbovee.com.

Thursday's Prospects

On Wednesday, July 29:

Of 500 large-cap stocks and exchange-traded funds in my analytical universe, 17 broke beyond their 20-day price channels, 15 to the upside and two to the downside.

No symbols that gave trading signals survived initial screening. The two finalists -- CNI and HAL -- had insufficiently high implied volatility.

There are two prospects for trades coinciding with earnings announcements under my Volatility Rules.

I shall do further analysis on Thursday, July 30.

Earnings season began July 8, with peak announcements lasting for three weeks. Under the exclusion rule that forbids me from opening new positions in stocks within 30 days of an earnings announcement, in month before the season begins increasing numbers of symbols will be removed from my prospective trades list during initial screening. The rule doesn't apply to trades under my Volatility Rules.

Potential trades keyed to events

The dates are those of the events, all of them earns announcements. Events prior to the opening bell are marked "am", during the trading day "mid", and after the closing bell "pm".


Thursday pm
FEYE
LNKD
Friday am
(none)

Methodology

The stocks in my analytical universe all have analyst coverage through the stock-ranking company Zacks Investment Research. Not all of the exchange-traded funds are so covered.

I screen the symbols for historical odds of a profitable signal in the direction of the breakout for the past 12 months.

For symbols whose odds of success are in the top or bottom thirds, I next screen for 1) suitability of the options grid, including implied volatility of three figures or greater on the strike prices I would need to use to build a position, 2) implied volatility in the 70th percentile or greater of its most recent rise, and 3) the absence of an earnings announcement within the next 30 days.

-- Tim Bovee, Fukuoka, Japan, July 29, 2015

References

My trading rules can be read here.

Alerts

Two social media feeds provide notification whenever something new is posted.
Disclaimer
Tim Bovee, Private Trader tracks the analysis and trades of a private trader for his own accounts. Nothing in this blog constitutes a recommendation to buy or sell stocks, options or any other financial instrument. The only purpose of this blog is to provide education and entertainment.
No trader is ever 100 percent successful in his or her trades. Trading in the stock and option markets is risky and uncertain. Each trader must make trading decision decisions for his or her own account, and take responsibility for the consequences.
License

Creative Commons License

All content on Tim Bovee, Private Trader by Timothy K. Bovee is licensed under a Creative Commons Attribution-ShareAlike 4.0 International License.

Based on a work at www.timbovee.com.Tss s ss'ss

Wednesday's Outcomes

GM gapped upward beyond the profit zone after publishing earnings, and I have exited the calls, transforming the position into a bull put spread.

-- Tim Bovee, Fukuoka, Japan, July 29, 2015

References

My volatility trading rules can be read here.

Alerts

Two social media feeds provide notification whenever something new is posted.
Disclaimer
Tim Bovee, Private Trader tracks the analysis and trades of a private trader for his own accounts. Nothing in this blog constitutes a recommendation to buy or sell stocks, options or any other financial instrument. The only purpose of this blog is to provide education and entertainment.
No trader is ever 100 percent successful in his or her trades. Trading in the stock and option markets is risky and uncertain. Each trader must make trading decision decisions for his or her own account, and take responsibility for the consequences.
License

Creative Commons License

All content on Tim Bovee, Private Trader by Timothy K. Bovee is licensed under a Creative Commons Attribution-ShareAlike 4.0 International License.

Based on a work at www.timbovee.com.

Monday, July 27, 2015

Monday's Outcomes

I analyzed five positions and opened positions on three: BIDU, FB and TSLA, analyzing and rejecting trades on TWTR and WFM because the grid wouldn't allow construction of a trade that had sufficient reward for the risk..

I had suggested in my Agenda post that TSLA's bid/ask spread was overly wide, but I obtained a narrower spread by changing the options series, and I've edited the Agenda to conform.

I declined to analyze NOV, DD and APC because of insufficient open interest on the options series I intended to trade.

My iron condor on DOW moved into unprofitable territory and I exited the puts, transforming the position into a bear call spread.

-- Tim Bovee, Portland, Oregon, July 27, 2015

References

My volatility trading rules can be read here.

Alerts

Two social media feeds provide notification whenever something new is posted.
Disclaimer
Tim Bovee, Private Trader tracks the analysis and trades of a private trader for his own accounts. Nothing in this blog constitutes a recommendation to buy or sell stocks, options or any other financial instrument. The only purpose of this blog is to provide education and entertainment.
No trader is ever 100 percent successful in his or her trades. Trading in the stock and option markets is risky and uncertain. Each trader must make trading decision decisions for his or her own account, and take responsibility for the consequences.
License

Creative Commons License

All content on Tim Bovee, Private Trader by Timothy K. Bovee is licensed under a Creative Commons Attribution-ShareAlike 4.0 International License.

Based on a work at www.timbovee.com.

TSLA Analysis

Update 8/1/2015: TSLA options expired out of the money for maximum profit.

Shares rose by 2.0% over five days, or a +145% annual rate. The options position produced a 100.00% yield on debit, for a +25,240% annual rate.

The electric vehicle and energy storage company Tesla Motors Inc. (TSLA), headquartered in Palo Alto, California, publishes earnings on Wednesday after the closing bell.
[TSLA in Wikipedia]

TSLA

I shall use the AUG1 weekly series of options, which trades for the last time nine days hence, on Aug. 7.

Ranges

Click on chart to enlarge.
TSLA at 12:05 p.m. New York time, 30 days hourly bars
Implied volatility stands at 50.4%, which is 3.3 times the VIX, a measure of volatility of the S&P 500 index. TSLA’s volatility stands in the 94th percentile of its most recent rise.

Ranges implied by options and the chart
WeekSD1 68.2%SD2 95%ChartEarns
Upper284.84307.77286.65272.16
Lower238.98216.05254.33251.66
Gain/loss8.8%17.5%
Implied volatility 1 and 2 standard deviations; chart support and resistance, maximum earns move

The Trade

The one standard deviation range covers a lot of ground on the grid and provides insufficient premium. I've built a proposed trade based on the maximum range of post-earnings movement.

Proposed Trade #1:
Iron condor, short the $275 calls and long the $280 calls,
short the $250 puts and long the $245 puts,
sold for a credit and expiring Aug. 8.
Probability of expiring out-of-the-money

AUG1StrikeOTM
Upper27586.5%
Lower25082.2%

That structure produces a 4.2:1 risk/reward ratio, which is higher than I'm willing to accept.

The stock price is downtrending, so if I trim the zone of profit, it will be at the top, while covering as much of the earnings range as possible.

Proposed Trade #2:
Iron condor, short the $270 calls and long the $275 calls,
short the $250 puts and long the $245 puts,
sold for a credit and expiring Aug. 8.
Probability of expiring out-of-the-money

AUG1StrikeOTM
Upper27070.1%
Lower25082.2%

The premium is $1.29, which is about a quarter of the width of the position’s wings.The stock at the time of purchase was priced at $260.98.

The risk/reward ratio is 2.9:1, which is high but acceptable.

The zone of profit in the proposed trade covers a $10 move either way. The biggest immediate move after each of the past four earnings announcements was $10.25, and the average was $6.64.

Decision for My Account

I've opened a position on TSLA as described in Proposed Trade #2.

The risk is a bit higher because I shrunk the profit zone, but I judge it to be acceptable. I've mitigated that risk by opening a smaller than usual position.

-- Tim Bovee, Portland, Oregon, July 27, 2015

References

My volatility trading rules can be read here.


Alerts


Two social media feeds provide notification whenever something new is posted.

Disclaimer
Tim Bovee, Private Trader tracks the analysis and trades of a private trader for his own accounts. Nothing in this blog constitutes a recommendation to buy or sell stocks, options or any other financial instrument. The only purpose of this blog is to provide education and entertainment.
No trader is ever 100 percent successful in his or her trades. Trading in the stock and option markets is risky and uncertain. Each trader must make trading decisions for his or her own account, and take responsibility for the consequences.
License

Creative Commons License

All content on Tim Bovee, Private Trader by Timothy K. Bovee is licensed under a Creative Commons Attribution-ShareAlike 4.0 International License.

Based on a work at www.timbovee.com.

BIDU Analysis

Update 8/5/2015: BIDU was on the edge of its profit zone as expiration neared and I exited for a profit.

Shares declined by 12.5% over nine days, or a -508% annual rate. The options produced a 141.2% yield on debit, for a +5,726% annul rate.

The Chinese-language internet search provider Baidu Inc. (BIDU), headquartered in Beijing, China publishes earnings on Monday before the opening bell.
[BIDU in Wikipedia]

BIDU

I shall use the AUG1 weekly series of options, which trades for the last time 11 days hence, on Aug. 7.

Ranges

Click on chart to enlarge.
BIDU at 11:25 a.m. New York time, 30 days hourly bars
Implied volatility stands at 47.8%, which is 3.1 times the VIX, a measure of volatility of the S&P 500 index. BIDU’s volatility stands at the peak of its most recent rise.

Ranges implied by options and the chart
WeekSD1 68.2%SD2 95%ChartEarns
Upper215.12231.59210.00220.88
Lower182.18165.71185.75176.42
Gain/loss8.3%16.6%
Implied volatility 1 and 2 standard deviations; chart support and resistance, maximum earns move

The Trade

BIDU's business is in China, although it is listed on the NASDAQ in New York. The sharp decline of China's stock markets has given BIDU a huge downside gap at the opening, and that risk of increased volatility must be kept in mind while building a trade.

Iron condor, short the $215 calls and long the $220 calls,
short the $170 puts and long the $165 puts,
sold for a credit and expiring Aug. 8.
Probability of expiring out-of-the-money

AUG1StrikeOTM
Upper21576.9%
Lower17088.0%

The premium is $1.23, which is 25% of the width of the position’s wings.The stock at the time of analysis was priced at $198.39.

The risk/reward ratio is 3.1:1.

The zone of profit in the proposed trade covers a $22.50 move either way. The biggest immediate move after each of the past four earnings announcements was $22.23, and the average was $15.77.

Decision for My Account

The risk/reward ratio is a bit high but otherwise, it's a reasonable trade. I've opened a position in BIDU as described above.

-- Tim Bovee, Portland, Oregon, July 27, 2015

References

My volatility trading rules can be read here.


Alerts


Two social media feeds provide notification whenever something new is posted.

Disclaimer
Tim Bovee, Private Trader tracks the analysis and trades of a private trader for his own accounts. Nothing in this blog constitutes a recommendation to buy or sell stocks, options or any other financial instrument. The only purpose of this blog is to provide education and entertainment.
No trader is ever 100 percent successful in his or her trades. Trading in the stock and option markets is risky and uncertain. Each trader must make trading decisions for his or her own account, and take responsibility for the consequences.
License

Creative Commons License

All content on Tim Bovee, Private Trader by Timothy K. Bovee is licensed under a Creative Commons Attribution-ShareAlike 4.0 International License.

Based on a work at www.timbovee.com.

FB Analysis

Update 7/8/2015: FB expired without value for maximum profit.

The share price declined by 1.0% over 11 days, or a -3% annual rate. The options produced a 100% yield on debit, for a +3,318% annual rate.

The social networking company Facebook Inc. (FB), headquartered in Menlo Park, California, will publish earnings on Wednesday after the closing bell.
[FB in Wikipedia]

FB

I shall use the AUG1 weekly series of options, which trades for the last time nine days hence, on Aug. 7.

Ranges

Click on chart to enlarge.
FB at 11:05 a.m. New York time, 30 days hourly bars
Implied volatility stands at 51.7%, which is 3.4 times the VIX, a measure of volatility of the S&P 500 index. FB’s volatility stands at the peak of its most recent rise.

Ranges implied by options and the chart
WeekSD1 68.2%SD2 95%ChartEarns
Upper103.47111.9999.2499.86
Lower86.4377.9185.2390.04
Gain/loss9.0%18.0%
Implied volatility 1 and 2 standard deviations; chart support and resistance, maximum earns move

The Trade

The maximum earnings move is narrower than both the one standard deviation range and the chart range. I've chosen to go with the 1SD range as my standard, since it is the widest of the three.

Iron condor, short the $104 calls and long the $106 calls,
short the $85 puts and long the $83 puts,
sold for a credit and expiring Aug. 8.
Probability of expiring out-of-the-money

AUG1StrikeOTM
Upper10478.6%
Lower8577.2%

The premium is $0.72, which is 36% of the width of the position’s wings.The stock at the time of analysis was priced at $94.39.

The risk/reward ratio is 1.7:1.

The zone of profit in the proposed trade covers a $9.50 move either way. The biggest immediate move after each of the past four earnings announcements was $4.91, and the average was $3.15.

Decision for My Account

I've opened a position in FB as described above.

-- Tim Bovee, Portland, Oregon, July 27, 2015

References

My volatility trading rules can be read here.


Alerts


Two social media feeds provide notification whenever something new is posted.

Disclaimer
Tim Bovee, Private Trader tracks the analysis and trades of a private trader for his own accounts. Nothing in this blog constitutes a recommendation to buy or sell stocks, options or any other financial instrument. The only purpose of this blog is to provide education and entertainment.
No trader is ever 100 percent successful in his or her trades. Trading in the stock and option markets is risky and uncertain. Each trader must make trading decisions for his or her own account, and take responsibility for the consequences.
License

Creative Commons License

All content on Tim Bovee, Private Trader by Timothy K. Bovee is licensed under a Creative Commons Attribution-ShareAlike 4.0 International License.

Based on a work at www.timbovee.com.

WFM Analysis

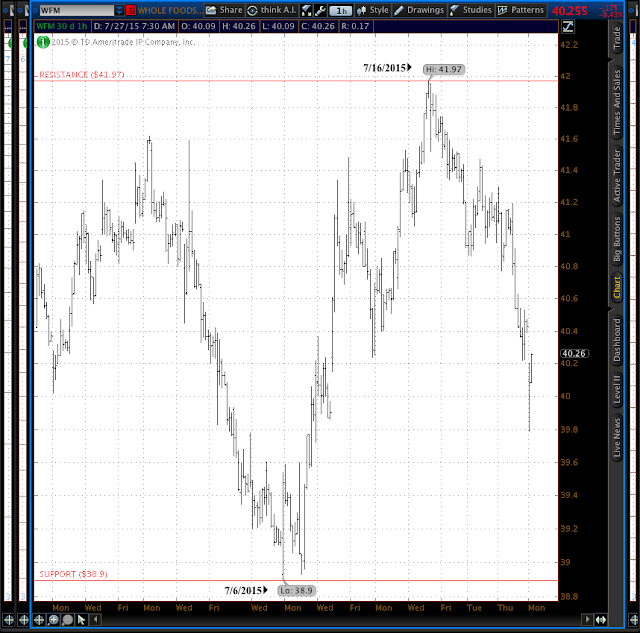
The organic foods grocery chain Whole Foods Market Inc. (WFM), headquartered in Austin, Texas, publishes earnings on Wednesday after the closing bell.

[WFM in Wikipedia]

WFM

I shall use the AUG1 weekly series of options, which trades for the last time nine days hence, on Aug. 7.

Ranges

Click on chart to enlarge.
WFM at 10:40 a.m. New York time, 30 days hourly bars
Implied volatility stands at 37.3%, which is 2.5 times the VIX, a measure of volatility of the S&P 500 index. WFM’s volatility stands at the peak of its most recent rise.

Ranges implied by options and the chart
WeekSD1 68.2%SD2 95%ChartEarns
Upper42.8645.4741.9745.12
Lower37.6635.0538.9035.40
Gain/loss6.5%12.9%
Implied volatility 1 and 2 standard deviations; chart support and resistance, maximum earns move

The Trade

WFM's situation is similar to that noted in my analysis of TWTR: The maximum movement immediately after earnings is wide, near the two standard deviation range. That lower premium and increases risk in relation to reward, although it also increases the odds of the price staying within the profit zone.

Iron condor, short the $45 calls and long the $46 calls,
short the $35 puts and long the $34 puts,
sold for a credit and expiring Aug. 8.
Probability of expiring out-of-the-money

AUG1StrikeOTM
Upper4589.9%
Lower3588.7%

The premium is $0.16, which is 16% of the width of the position’s wings. The stock at the time of analysis was priced at $40.11.

The risk/reward ratio is 5.3:1.

The zone of profit in the proposed trade covers a $5 move either way. The biggest immediate move after each of the past four earnings announcements was $4.86, and the average was $3.30.

The draft trade covers in the zone of profit the entirety of the one standard deviation and chart ranges, leaving only slivers of the two standard deviation and earnings ranges outside the zone.

WFM is a downtrending stock, whose average earnings moves range from $36.97 to $43.56. One possible adjustment would be to lower the top boundary of the profit zone so near the top of the average earnings moves, while retaining the lower maximum earnings moves level for the lower boundary.

Iron condor, short the $43 calls and long the $44 calls,
short the $35 puts and long the $34 puts,
sold for a credit and expiring Aug. 8.
Probability of expiring out-of-the-money

AUG1StrikeOTM
Upper4379.2%
Lower3588.7%

Under the second scenario, the premium is $0.26, which is about a quarter of the width of the position’s wings. The stock at the time of analysis was priced at $40.06.

The risk/reward ratio is 2.8:1.

The zone of profit in the proposed trade covers a $4 move either way. The biggest immediate move after each of the past four earnings announcements was $4.86, and the average was $3.30.

Decision for My Account

Either scenario produces a risk/reward ratio that is too high for my liking. I'm passing on WFM and won't be opening a position to coincide with the company's earnings announcement.

-- Tim Bovee, Portland, Oregon, July 27, 2015

References

My volatility trading rules can be read here.


Alerts


Two social media feeds provide notification whenever something new is posted.

Disclaimer
Tim Bovee, Private Trader tracks the analysis and trades of a private trader for his own accounts. Nothing in this blog constitutes a recommendation to buy or sell stocks, options or any other financial instrument. The only purpose of this blog is to provide education and entertainment.
No trader is ever 100 percent successful in his or her trades. Trading in the stock and option markets is risky and uncertain. Each trader must make trading decisions for his or her own account, and take responsibility for the consequences.
License

Creative Commons License

All content on Tim Bovee, Private Trader by Timothy K. Bovee is licensed under a Creative Commons Attribution-ShareAlike 4.0 International License.

Based on a work at www.timbovee.com.

TWTR Analysis

The online social media company Twitter Inc. (TWTR), headquartered in San Francisco, California, publishes earnings on Tuesday after the closing bell.

[TWTR in Wikipedia]

TWTR

I shall use the AUG1 weekly series of options, which trades for the last time 11 days hence, on Aug. 7.

Ranges

Click on chart to enlarge.
TWTR at 10:13 a.m. New York time, 30 days hourly bars
Implied volatility stands at 70.1%, which is 4.5 times the VIX, a measure of volatility of the S&P 500 index. TWTR’s volatility stands at the peak of its most recent rise.

Ranges implied by options and the chart
WeekSD1 68.2%SD2 95%ChartEarns
Upper38.5742.7736.7543.77
Lower30.1925.9934.3124.99
Gain/loss12.2%24.4%
Implied volatility 1 and 2 standard deviations; chart support and resistance, maximum earns move

The Trade

TWTR presents the spectacle of a symbol whose maximum post-earnings movements are greater than the two standard deviation range, a sight I have rarely seen and one that will reduce the premium if I place that entire range within the zone of profit.

The best coverage I can provide on this grid is this:

Iron condor, short the $44 calls and long the $45 calls,
short the $27 puts and long the $25 puts,
sold for a credit and expiring Aug. 8.
Probability of expiring out-of-the-money

AUG1StrikeOTM
Upper4492.1%
Lower2788.2%

The premium is $0.22, which is 15% of the width of the position’s wings.The stock at the time of analysis was priced at $34.23.

The risk/reward ratio is 9:1.

The zone of profit in the proposed trade covers  $8,50 move either way. The biggest immediate move after each of the past four earnings announcements was $9.39, and the average was $7.37.

I could increase the premium, and thereby lower the risk, by lower the upper boundary of the profit zone. However, I judge that to be unwise because TWTR has been in a neutral trend for the past month, not a downtrend. Today's decline appears to be a market-wide phenomenon tied to a sharp market decline in China and so may be an ephemeral phenomenon. I'm reluctant to take the risk of shrinking the coverage zone.

Decision for My Account

I'm passing on TWTR because of I can't provide an adequately wide profit zone for sufficient premium. I won't be placing a trade to coincide with TWTR's earnings announcement.

-- Tim Bovee, Portland, Oregon, July 27, 2015

References

My volatility trading rules can be read here.


Alerts


Two social media feeds provide notification whenever something new is posted.

Disclaimer
Tim Bovee, Private Trader tracks the analysis and trades of a private trader for his own accounts. Nothing in this blog constitutes a recommendation to buy or sell stocks, options or any other financial instrument. The only purpose of this blog is to provide education and entertainment.
No trader is ever 100 percent successful in his or her trades. Trading in the stock and option markets is risky and uncertain. Each trader must make trading decisions for his or her own account, and take responsibility for the consequences.
License

Creative Commons License

All content on Tim Bovee, Private Trader by Timothy K. Bovee is licensed under a Creative Commons Attribution-ShareAlike 4.0 International License.

Based on a work at www.timbovee.com.

Monday's Agenda

This is the last trading day before my flight to East Asia, so I've jammed into this one day three days worth of potential trades -- those publishing earnings between Monday after the closing bell and  Thursday before the opening bell.

The symbols under consideration are TWTR, NOV, WFM, DD, APC, FB, BIDU and TSLA.

However, also coming into play is the fact that we are now 19 days into the earnings season. At this point I usually find that I'm running short of funds to commit to trades. Almost all of my cash is already on the table, and I need to start choosing carefully among trades for reasons having nothing to do with the technical aspects I usually pay attention to.

A narrow bid/ask spread makes for a less expensive trade and therefore makes it more attractive. TWTR, WFM, FB, BIDU and TSLA all have spread below 5% there therefore will be my priorities. The rest have spreads of 5% and greater.

-- Tim Bovee, Portland, Oregon, July 27, 2015

References

My volatility trading rules can be read here.

Alerts

Two social media feeds provide notification whenever something new is posted.
Disclaimer
Tim Bovee, Private Trader tracks the analysis and trades of a private trader for his own accounts. Nothing in this blog constitutes a recommendation to buy or sell stocks, options or any other financial instrument. The only purpose of this blog is to provide education and entertainment.
No trader is ever 100 percent successful in his or her trades. Trading in the stock and option markets is risky and uncertain. Each trader must make trading decision decisions for his or her own account, and take responsibility for the consequences.
License

Creative Commons License

All content on Tim Bovee, Private Trader by Timothy K. Bovee is licensed under a Creative Commons Attribution-ShareAlike 4.0 International License.

Based on a work at www.timbovee.com.Tss s ss'ss

Sunday, July 26, 2015

Traveling and Trading

I'm flying from the United States to East Asia on Tuesday, July 28, and shall be there until mid-August.

As a result of the time zone difference, my posts on Private Trader will occur later at night than they normally do, although I shall make my trades during the market session.

Analyses will be posted prior to the market open on the prospective trading day. The "Outcomes" noting those trades and any exits will be posted after the market close, most likely several hours afterward.

I'll be airborne for the entire market session on Tuesday and will have little time to prepare for Wednesday's session once I arrive. So on Monday I shall be looking at three day's worth of trades coinciding with earnings announcements, eight prospective trades altogether.

No "Wednesday's Prospects" will be posted this week.

The most convenient way to keep up with postings on Private Trader is through notifications via Twitter or Facebook

-- Tim Bovee, Portland, Oregon, July 26, 2015

Disclaimer
Tim Bovee, Private Trader tracks the analysis and trades of a private trader for his own accounts. Nothing in this blog constitutes a recommendation to buy or sell stocks, options or any other financial instrument. The only purpose of this blog is to provide education and entertainment.
No trader is ever 100 percent successful in his or her trades. Trading in the stock and option markets is risky and uncertain. Each trader must make trading decisions for his or her own account, and take responsibility for the consequences.
License

Creative Commons License

All content on Tim Bovee, Private Trader by Timothy K. Bovee is licensed under a Creative Commons Attribution-ShareAlike 4.0 International License.

Based on a work at www.timbovee.com.


The Week Ahead: GDP, FOMC, Durables

The first look at 2nd quarter gross domestic product will be published on Thursday at 8:30 a.m. New York time.

The release comes a day after the Federal Open Market Committee holds a two-day meeting on when to raise interest rates. The meeting statement will be out on Wednesday at 2 p.m.

One other major economic report has potential influence over the markets: Durable goods orders, published Monday at 8:30 a.m.

Leading indicators (in descending order of importance):

The interest rate spread between 10-year Treasuries and the federal funds rate, reported continually during market hours.

The M2 money supply, at 4:30 p.m. Thursday.

The S&P 500 index, reported continually during market hours.

Average weekly initial jobless claims, at 8:30 a.m. Thursday. 

The index of consumer expectations from the Reuters/University of Michigan consumer sentiment report, at 10 a.m. Friday.

Items of interest, arranged by day:

Monday: Durable goods orders at 8:30 a.m. and the Dallas Federal Reserve manufacturing survey at 10:30 a.m.

Tuesday: The S&P Case-Shiller home price index in 20 metropolitan areas at 9 a.m. and the Conference Board consumer confidence report at 10 a.m.

Wednesday: Pending home sales at 10 a.m., petroleum inventories at 10:30 a.m. and the FOMC statement at 2 p.m.

Thursday: The GDP and jobless claims at 8:30 a.m. and the M2 money supply at 4:30 p.m.

Friday: The employment cost index at 8:30 a.m., Chicago purchasing managers index at 9:45 a.m. and consumer sentiment at 10 a.m.

I also keep an eye on the Baltic Dry Index, updated daily, and the 5-year implied inflation rate based on U.S. Treasury yields, which presently stands at 1.46%.

Treasury Debt

Bills
  • 4-week: Announcement Monday 11 a.m., auction Tuesday 11:30 a.m., settlement Thursday.
  • 3-month: Auction Monday 11:30 a.m., announcement Thursday 11 a.m.
  • 6-month: Auction Monday 11:30 a.m., announcement Thursday 11 a.m.
Notes
  • 2-year: Auction Tuesday 1 p.m., settlement Friday.
  • 2-year floating rate: Auction Wednesday 1 p.m.
  • 5-year: Auction Wednesday 1 p.m., settlement Friday.
  • 7-year: Auction Thursday 1 p.m.
Bonds
  • None.
TIPS

  • 10-year: ,Settlement Friday.

Fedsters

Aside from the Federal Open Market Committee statement on Wednesday, there is nothing from the Fed glitterati but the sound of silence.

Analytical universe

This week I shall be analyzing new bull and bear signals among 500 large-cap stocks and exchange-traded funds.

Good trading.


-- Tim Bovee, Portland, Oregon, July 26, 2015

References

My trading rules can be read here.


Alerts


Two social media feeds provide notification whenever something new is posted.

License

Creative Commons License

All content on Tim Bovee, Private Trader by Tim Bovee is licensed under a Creative Commons Attribution-ShareAlike 4.0 International License.

Based on a work at www.timbovee.com

Saturday, July 25, 2015

Monday's Prospects

On Friday, July 24:

Of 500 large-cap stocks and exchange-traded funds in my analytical universe, 21 broke beyond their 20-day price channels, three to the upside and 18 to the downside.

No symbols that gave trading signals survived initial screening.

There are eight prospects for trades coinciding with earnings announcements under my Volatility Rules. Three are up for Monday's trades. However, I shall be flying to Japan on Tuesday, and so am considering all potential earnings plays for three days, Monday through Wednesday.

I shall do further analysis on Monday, July 27 and anticipate no further analysis until Thursday, July 30.

Earnings season began July 8, with peak announcements lasting for three weeks. Under the exclusion rule that forbids me from opening new positions in stocks within 30 days of an earnings announcement, in month before the season begins increasing numbers of symbols will be removed from my prospective trades list during initial screening. The rule doesn't apply to trades under my Volatility Rules.

Potential trades keyed to events

The dates are those of the events, all of them earns announcements. Events prior to the opening bell are marked "am", during the trading day "mid", and after the closing bell "pm".

Monday pm
BIDU
Tuesday am
NOV
DD
Tuesday pm
TWTR
APC
Wednesday am
(none)
Wednesday pm
FB
WFM
TSLA
Thursday am
(none)

Methodology

The stocks in my analytical universe all have analyst coverage through the stock-ranking company Zacks Investment Research. Not all of the exchange-traded funds are so covered.

I screen the symbols for historical odds of a profitable signal in the direction of the breakout for the past 12 months.

For symbols whose odds of success are in the top or bottom thirds, I next screen for 1) suitability of the options grid, including implied volatility of three figures or greater on the strike prices I would need to use to build a position, 2) implied volatility in the 70th percentile or greater of its most recent rise, and 3) the absence of an earnings announcement within the next 30 days.

-- Tim Bovee, Portland, Oregon, July 25, 2015

References

My trading rules can be read here.

Alerts

Two social media feeds provide notification whenever something new is posted.
Disclaimer
Tim Bovee, Private Trader tracks the analysis and trades of a private trader for his own accounts. Nothing in this blog constitutes a recommendation to buy or sell stocks, options or any other financial instrument. The only purpose of this blog is to provide education and entertainment.
No trader is ever 100 percent successful in his or her trades. Trading in the stock and option markets is risky and uncertain. Each trader must make trading decision decisions for his or her own account, and take responsibility for the consequences.
License

Creative Commons License

All content on Tim Bovee, Private Trader by Timothy K. Bovee is licensed under a Creative Commons Attribution-ShareAlike 4.0 International License.

Based on a work at www.timbovee.com.Tss s ss'ss

Saturday's Outcomes

Four positions expired on Saturday, and I've updated their analyses with results: C, JNJ, JPM and UNH.

-- Tim Bovee, Portland, Oregon, July 25, 2015

References

My volatility trading rules can be read here.

Alerts

Two social media feeds provide notification whenever something new is posted.
Disclaimer
Tim Bovee, Private Trader tracks the analysis and trades of a private trader for his own accounts. Nothing in this blog constitutes a recommendation to buy or sell stocks, options or any other financial instrument. The only purpose of this blog is to provide education and entertainment.
No trader is ever 100 percent successful in his or her trades. Trading in the stock and option markets is risky and uncertain. Each trader must make trading decision decisions for his or her own account, and take responsibility for the consequences.
License

Creative Commons License

All content on Tim Bovee, Private Trader by Timothy K. Bovee is licensed under a Creative Commons Attribution-ShareAlike 4.0 International License.

Based on a work at www.timbovee.com.

Friday, July 24, 2015

Friday's Outcomes

I analyzed NSC but declined to take the trade.

-- Tim Bovee, Portland, Oregon, July 23, 2015

References

My volatility trading rules can be read here.

Alerts

Two social media feeds provide notification whenever something new is posted.
Disclaimer
Tim Bovee, Private Trader tracks the analysis and trades of a private trader for his own accounts. Nothing in this blog constitutes a recommendation to buy or sell stocks, options or any other financial instrument. The only purpose of this blog is to provide education and entertainment.
No trader is ever 100 percent successful in his or her trades. Trading in the stock and option markets is risky and uncertain. Each trader must make trading decision decisions for his or her own account, and take responsibility for the consequences.
License

Creative Commons License

All content on Tim Bovee, Private Trader by Timothy K. Bovee is licensed under a Creative Commons Attribution-ShareAlike 4.0 International License.

Based on a work at www.timbovee.com.