Because the signal to close came as part of a massive bear move generally, I delayed a day in selling in anticipation of a rebound. The rebound happened, allowing me to recover 0.9% of the decline.
I held the position, as long shares, for 36 days, an during that period it yielded a 3.9% gain, or 39.5% annualized.
iShares MSCI Italy Capped ETF (EWI) is an exchange-traded fund tracking the MSCI Italy 25/50 Index. A trader who buys EWI is bullish on the Italian markets, economy and government.
(I'll pause here so all can savor a moment of gentle incredulity at the expense of the Italians, and then a brief frisson of embarrassment as we consider the foolishness of our own markets, economies and governments. As an American, I can say with perfect honesty that my country stands second to few in the rich world when it comes to market and economic foolishness as well as misgovernance. Also, we are a leader in applying stereotypes to other nations -- we love to do that. But, onward...)
It is true that Italy has been unstable in recent years under the impact of the recession. But that's a fundamental way of looking at things. I base my trading on stats, charts and trends.
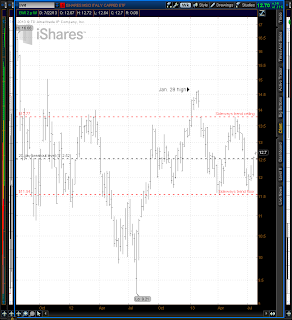
EWI broke above its 20-day price channel on Friday and confirmed the bull signal on Monday by trading higher still.
 |
| EWI 2-year weekly bars |
In any case, it's clear that Friday's breakout was an artifact of the fairly arbitrary 20-day rule used in Turtle trading to calculate bull and bear signals, rather than a break into a true trend.
I see a rise from the present $12.70 to $13.77 (8.4%) as being well within reach, and it certainly is a good return even without leverage. But the cautious trader my be prepared for a reversal above the, say, $13.50 or so.
This is EWI's fifth bull signal since its present trend began on the weekly chart. Three of the completed signals were profitable, for an average yield of 6.7% over 38 days. The unsuccessful trade lost 7% over 13 days.
The loser was an upward spike and next-day reversal in October 2012 amid rising yields on Italian bonds. The scale of that loss produces a negative 0.3% win/lose yield spread. But given the 3:1 odds in favor of winning, I don't find that to be a deal-killer.
The other survivor of my initial screening over the weekend was Sharp Corp. (SHCAY). However, it failed confirmation by trading Monday below its breakout level.
Fully 20% of EWI's value is accounted for by oil and gas multinational Eni SpA. The "Capped" part of the fund title means that no single holding can constitute more than 25% of the index, so Eni is nearing the limit.
Oil and gas are subject to global forces created far beyond the Italian national economy, so in some ways the Italy fund isn't quite as Italian as it may seem at first glance. It is a heavy a fossil fuels play, especially when other major holdings like the utility Enel SpA and the automaker Fiat SpA are taken into account.
EWI on average trades 799,000 shares a day, sufficient to support a moderate selection of option strike prices with open interest running in the two- and three-figure range. The front-month at-the-money bid/ask spread on calls is huge, at 21.4%.
I won't trade anything with that large a spread, so any position I open in EWI would need to be structured as shares.
Implied volatility on EWI is running at 27%, in the bottom half of the six-month range. It has been undulating sideways since the start of July.
Options are pricing in confidence that 68.2% of trades will fall between $11.80 and $13.59 over the next month, for a potential gain or loss of 7%, and between $12.27 and $13.13 over the next week.
Calls are trading near their five-day average volume and puts, about 11% below average.
The fair-price zone on Monday's 30-minute chart runs from $12.67 to $12.70, encompassing 68.2% of trades surrounding the most-traded price, $12.68. It's a remarkably unvolatile trading day, with each half hour seeing trades at the most-traded price.
EWI goes ex-dividend in December for a semi-annual payout yielding 2.42% annualized at today's prices.
Decision for my account: I'll open a bull position in EWI on Tuesday if it trades above the breakout level, $12.52. I'll structure the position as long shares. In entering the position, I'll be mindful of the strong likelihood of a reversal above the $13.50 level and shall exit the position if it fails to show upward momentum above that price, breaking my exit rules if necessary.
References
My trading rules can be read here. And the classic Turtle Trading rules on which my rules are based can be read here.
At several points in my analysis I use the number 68.2%. This comes from statistics and refers to the one standard deviation boundaries, which are expected to contain 68.2% of whatever is being studied. Putting it another way, given an item (a trade or whatever), there is a 68.2% chance that it will appear within those boundaries.
Disclaimer
Tim Bovee, Private Trader tracks the analysis and trades of a private trader for his own accounts. Nothing in this blog constitutes a recommendation to buy or sell stocks, options or any other financial instrument. The only purpose of this blog is to provide education and entertainment.
No trader is ever 100 percent successful in his or her trades. Trading in the stock and option markets is risky and uncertain. Each trader must make trading decision decisions for his or her own account, and take responsibility for the consequences.
No comments:
Post a Comment